Iris
#1.datasets = load_iris()
#StratifiedGroupKFold
#sclaer 적용 scaler = MinMaxScaler()
#2. 모델 model = RandomForestClassifier()
#3. 훈련 model.fit(x,y)
#4. 평가 예측


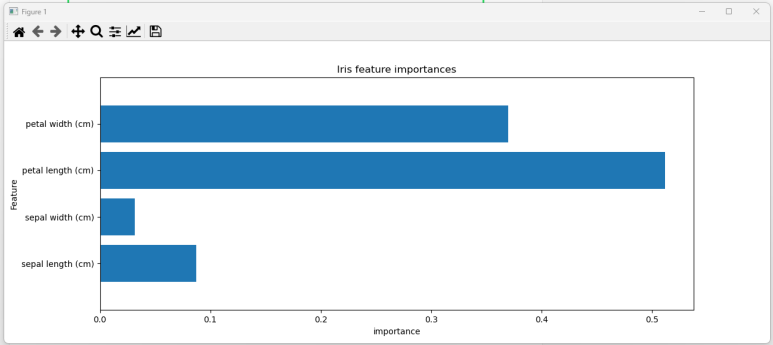
#시각화
import matplotlib.pyplot as plt
n_features = datasets.data.shape[1]
plt.barh(range(n_features), model.feature_importances_)
plt.yticks(np.arange(n_features), datasets.feature_names)
plt.title("Iris feature importances")
plt.ylabel('Feature')
plt.xlabel('importance')
plt.ylim(-1, n_features) #가로로 보기

plt.show()
모델마다 중요도가 다르게 출력되기 때문에 모델들 비교 필수
wine - Randomforest()

wine - DecisionTreeClassifier()

제일 중요도 낮은 값 빼기 - train,test set 전에
1. drop_features
x =np.delete(x, 0, axis =1) #(150, 3)  acc:   1.0
x =np.delete(x, 1, axis =1) #(150, 2)결과 acc:   0.98

2.
x = x.drop(columns=[x.columns[2]])'[네이버클라우드] 클라우드 기반의 개발자 과정 7기 > AI' 카테고리의 다른 글
| [수업자료] ml2 오늘의 코드 -gridsearch, random, bagging (0) | 2023.05.16 |
|---|---|
| [수업자료] ml1 오늘의 코드3 (0) | 2023.05.16 |
| 머신러닝 1 -model, scaling (0) | 2023.05.15 |
| heatmap NaN, label Encoding - 팀플 쓰기 (2) | 2023.05.12 |
| [5-1] 개념정리 - 자연어처리(NLP) 기초 (0) | 2023.05.12 |